Making credit data easier to understand and act on
The problem wasn't too much data. It was too little clarity.
Credit information lives in many places. The challenge was to show what matters and what to do next.
-
Scores without context
A number without a clear explanation of what it means.
-
Fragmented data
Users compare information across separate bureaus.
-
No clear priorities
Every metric competes for attention.
Three patterns shaped the direction
We reviewed existing credit and finance products to see where reading credit data gets hard.
| Pattern in the market | Direction |
|---|---|
| A number, with no explanation | Say what the score means |
| Each bureau in its own report | One view for all three |
| Every metric looks equally important | Rank factors by impact |
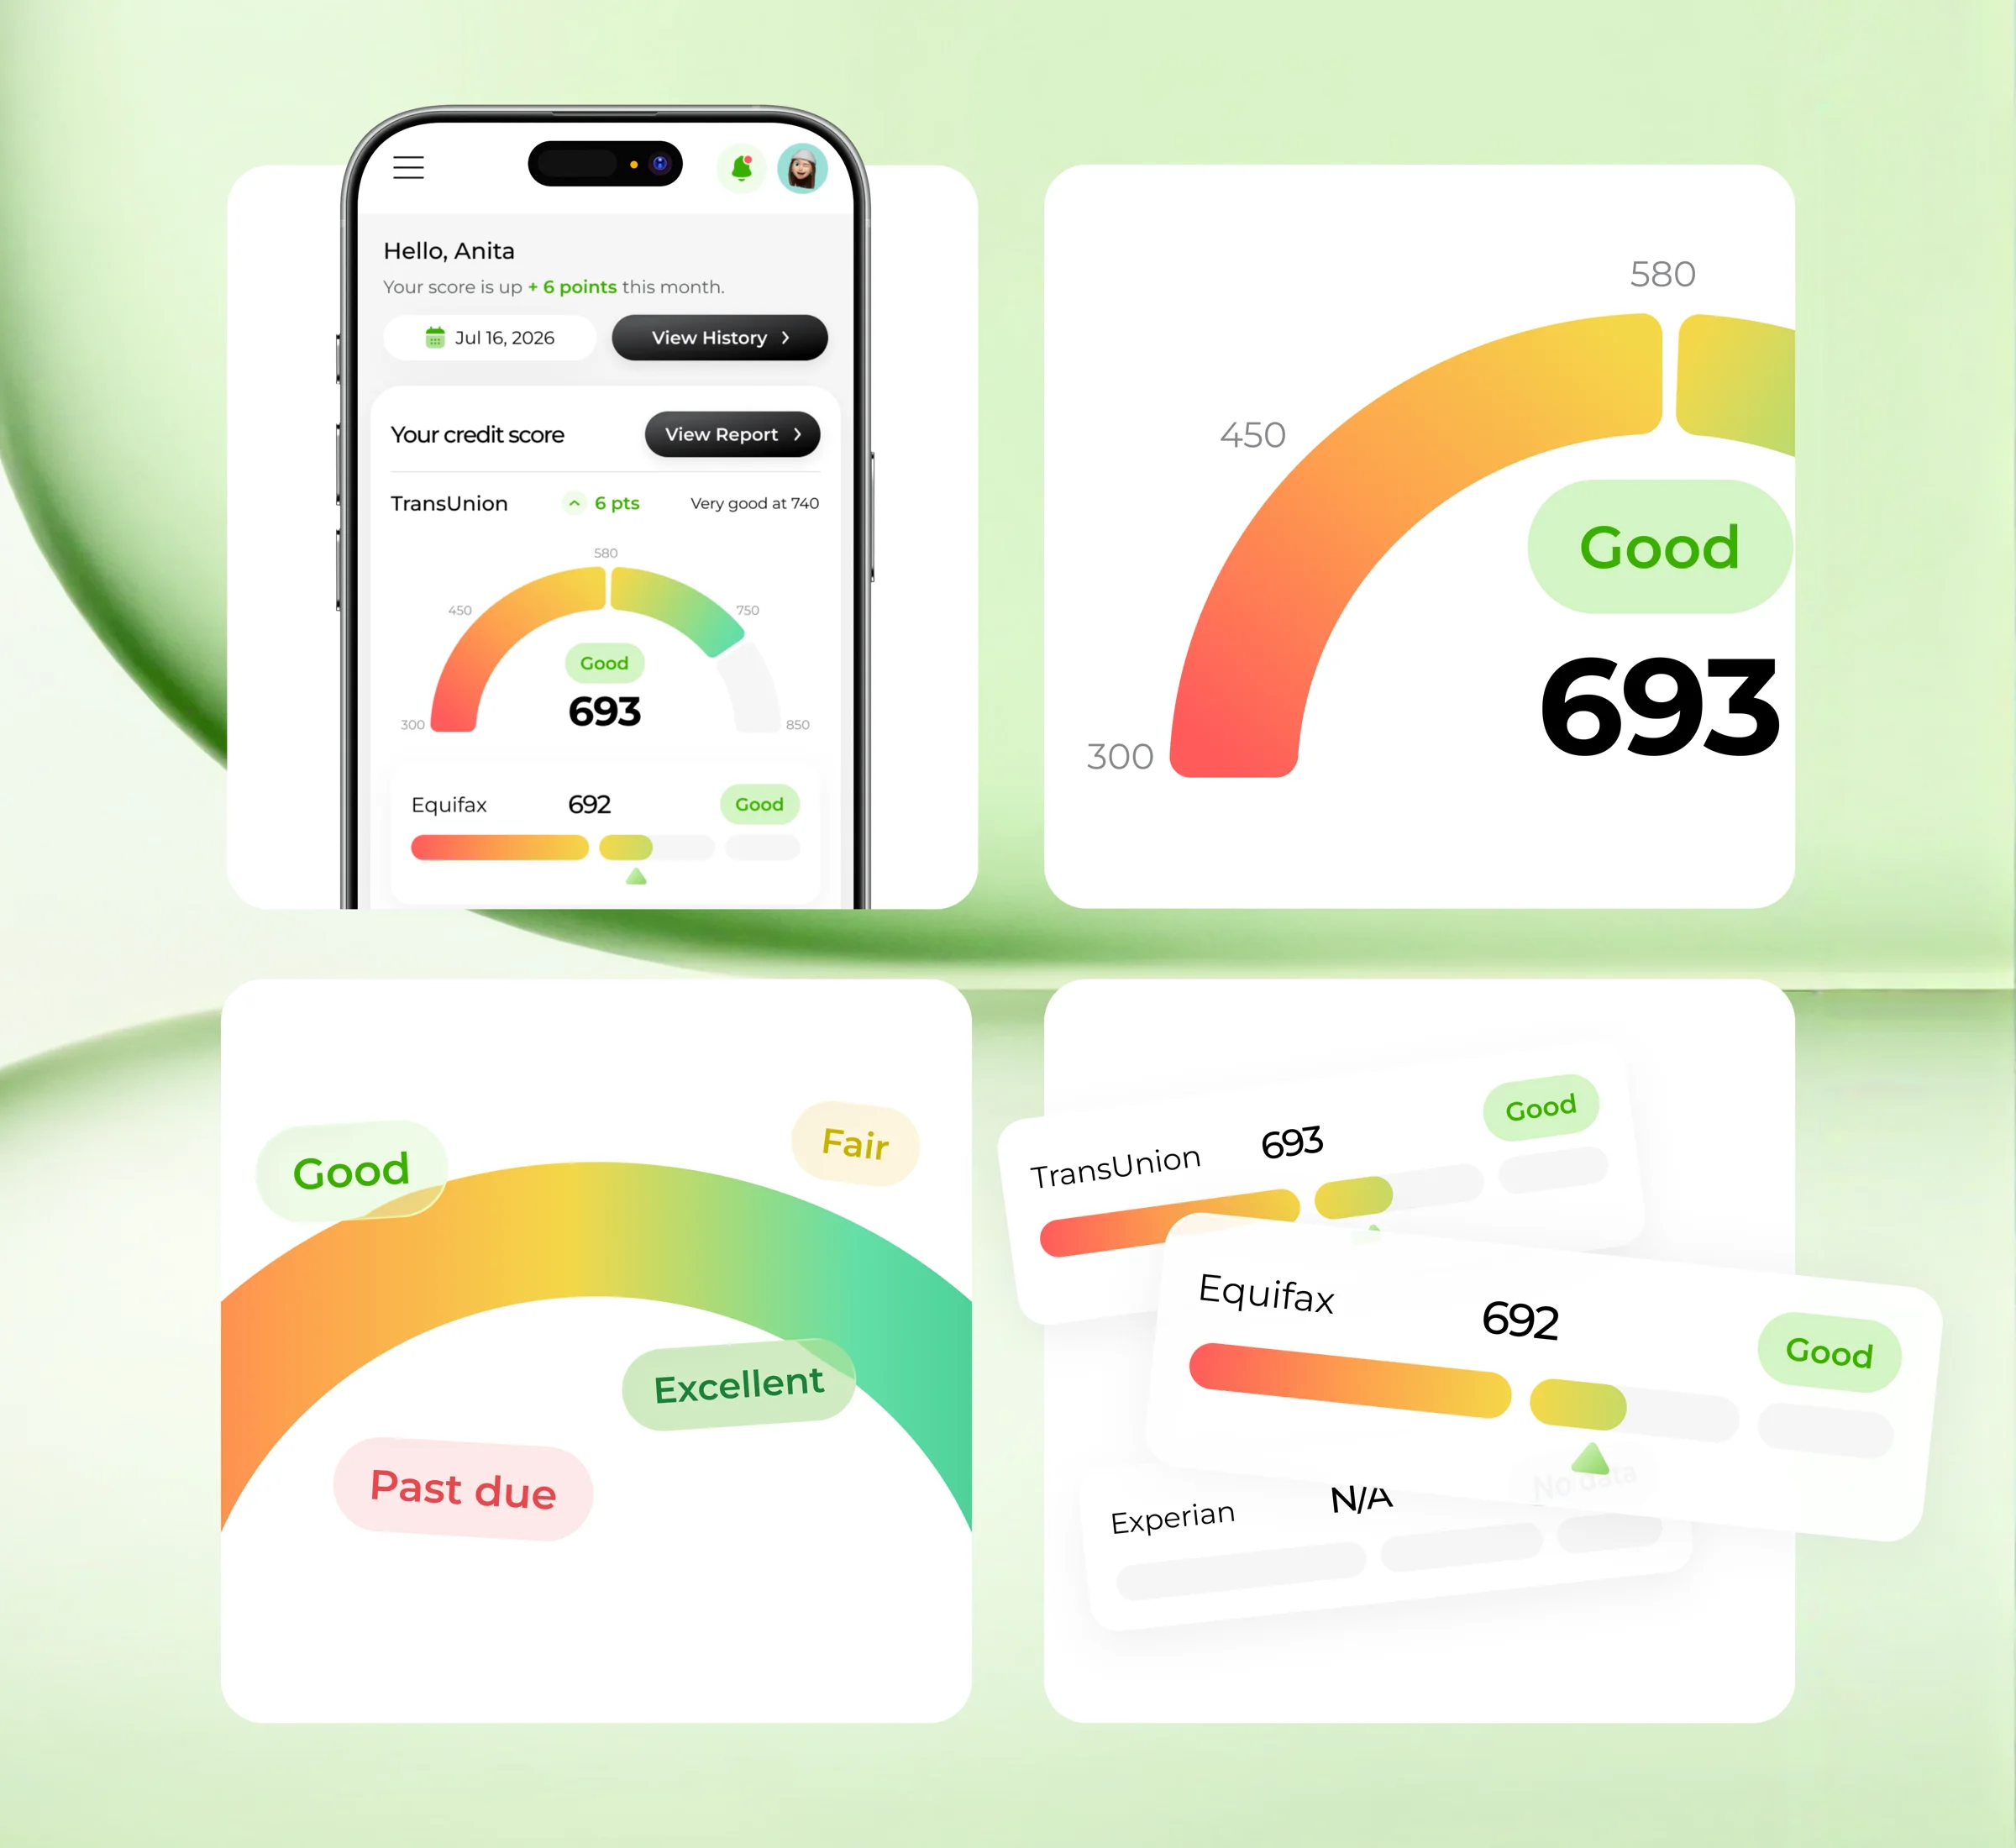
Three decisions defined the product
Each principle set one consistent way to present credit information so users understand it faster.
01. Score first
The score and its status appear before supporting details.
02. Color communicates status
A shared five-level scale keeps status meanings consistent.
03. Bureaus side by side
A consistent layout makes differences easier to spot.
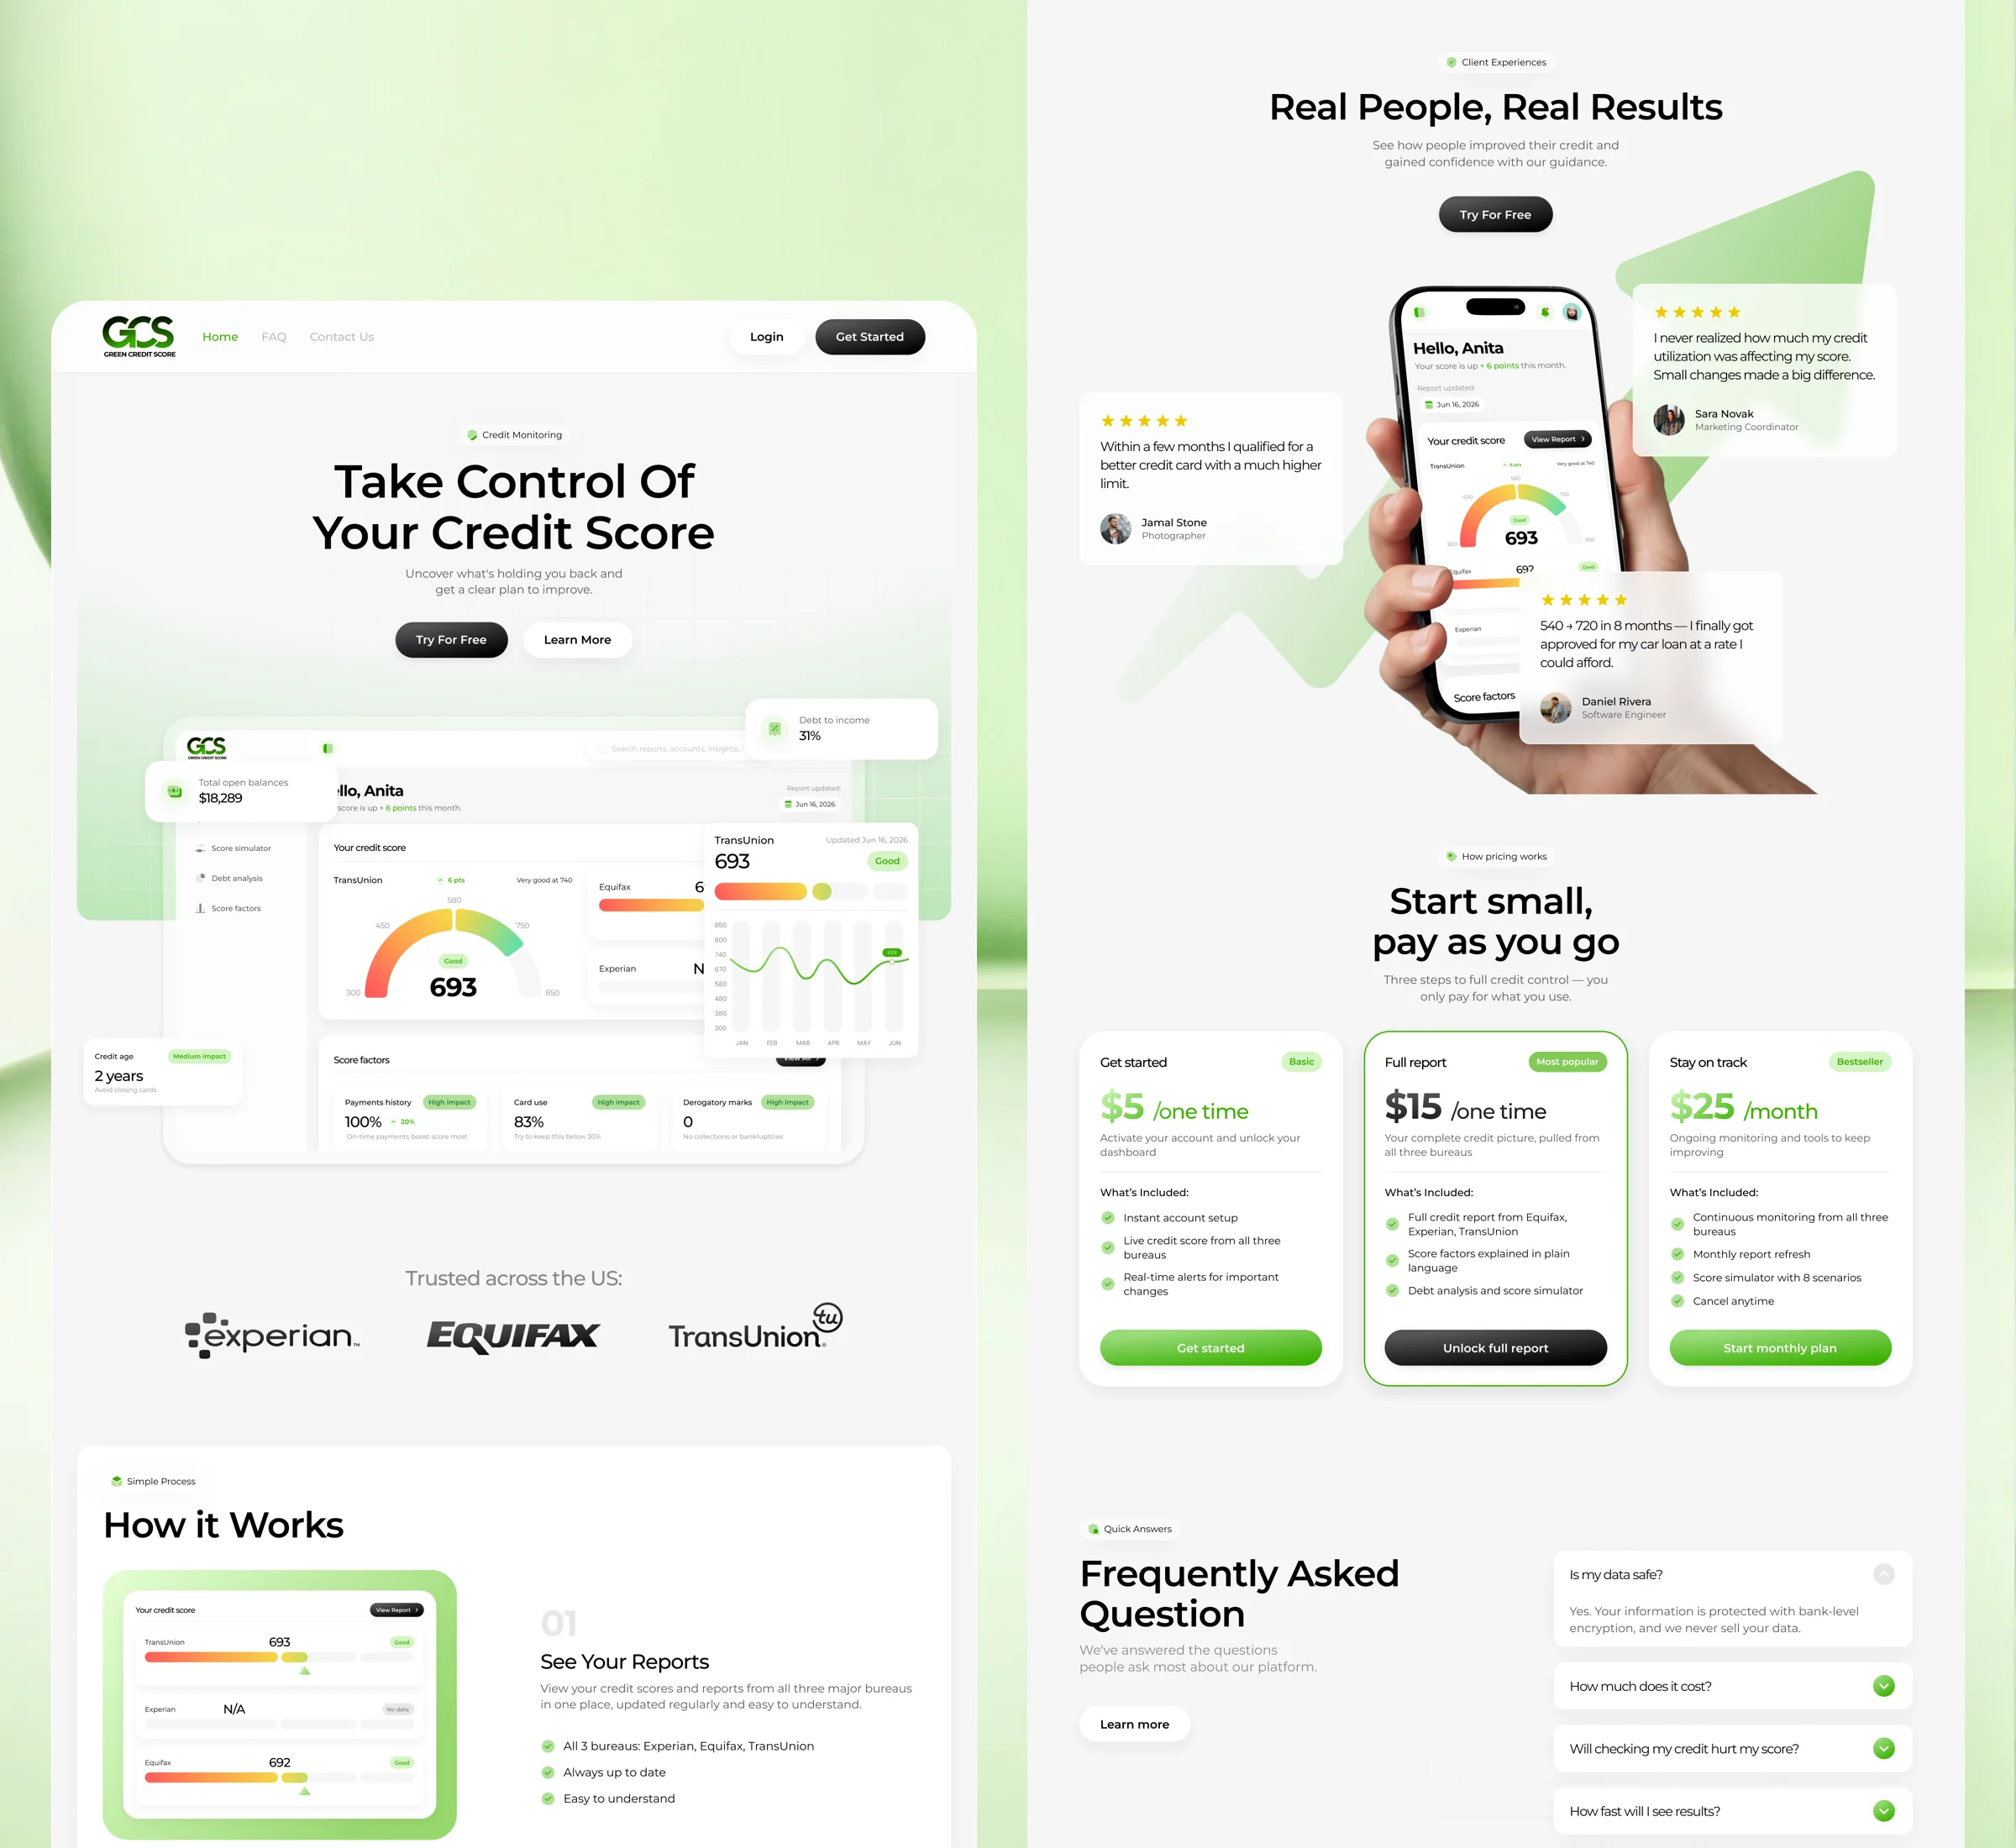
Explain the value before asking for commitment
The landing page introduces the product, shows its benefits and gives users a clear path to getting started.
- Explain
Introduce the product
Show what users can understand and manage.
- Build confidence
Answer key questions
Present features, pricing and FAQs.
- Convert
Make the next step clear
Keep the path to sign-up easy to find.
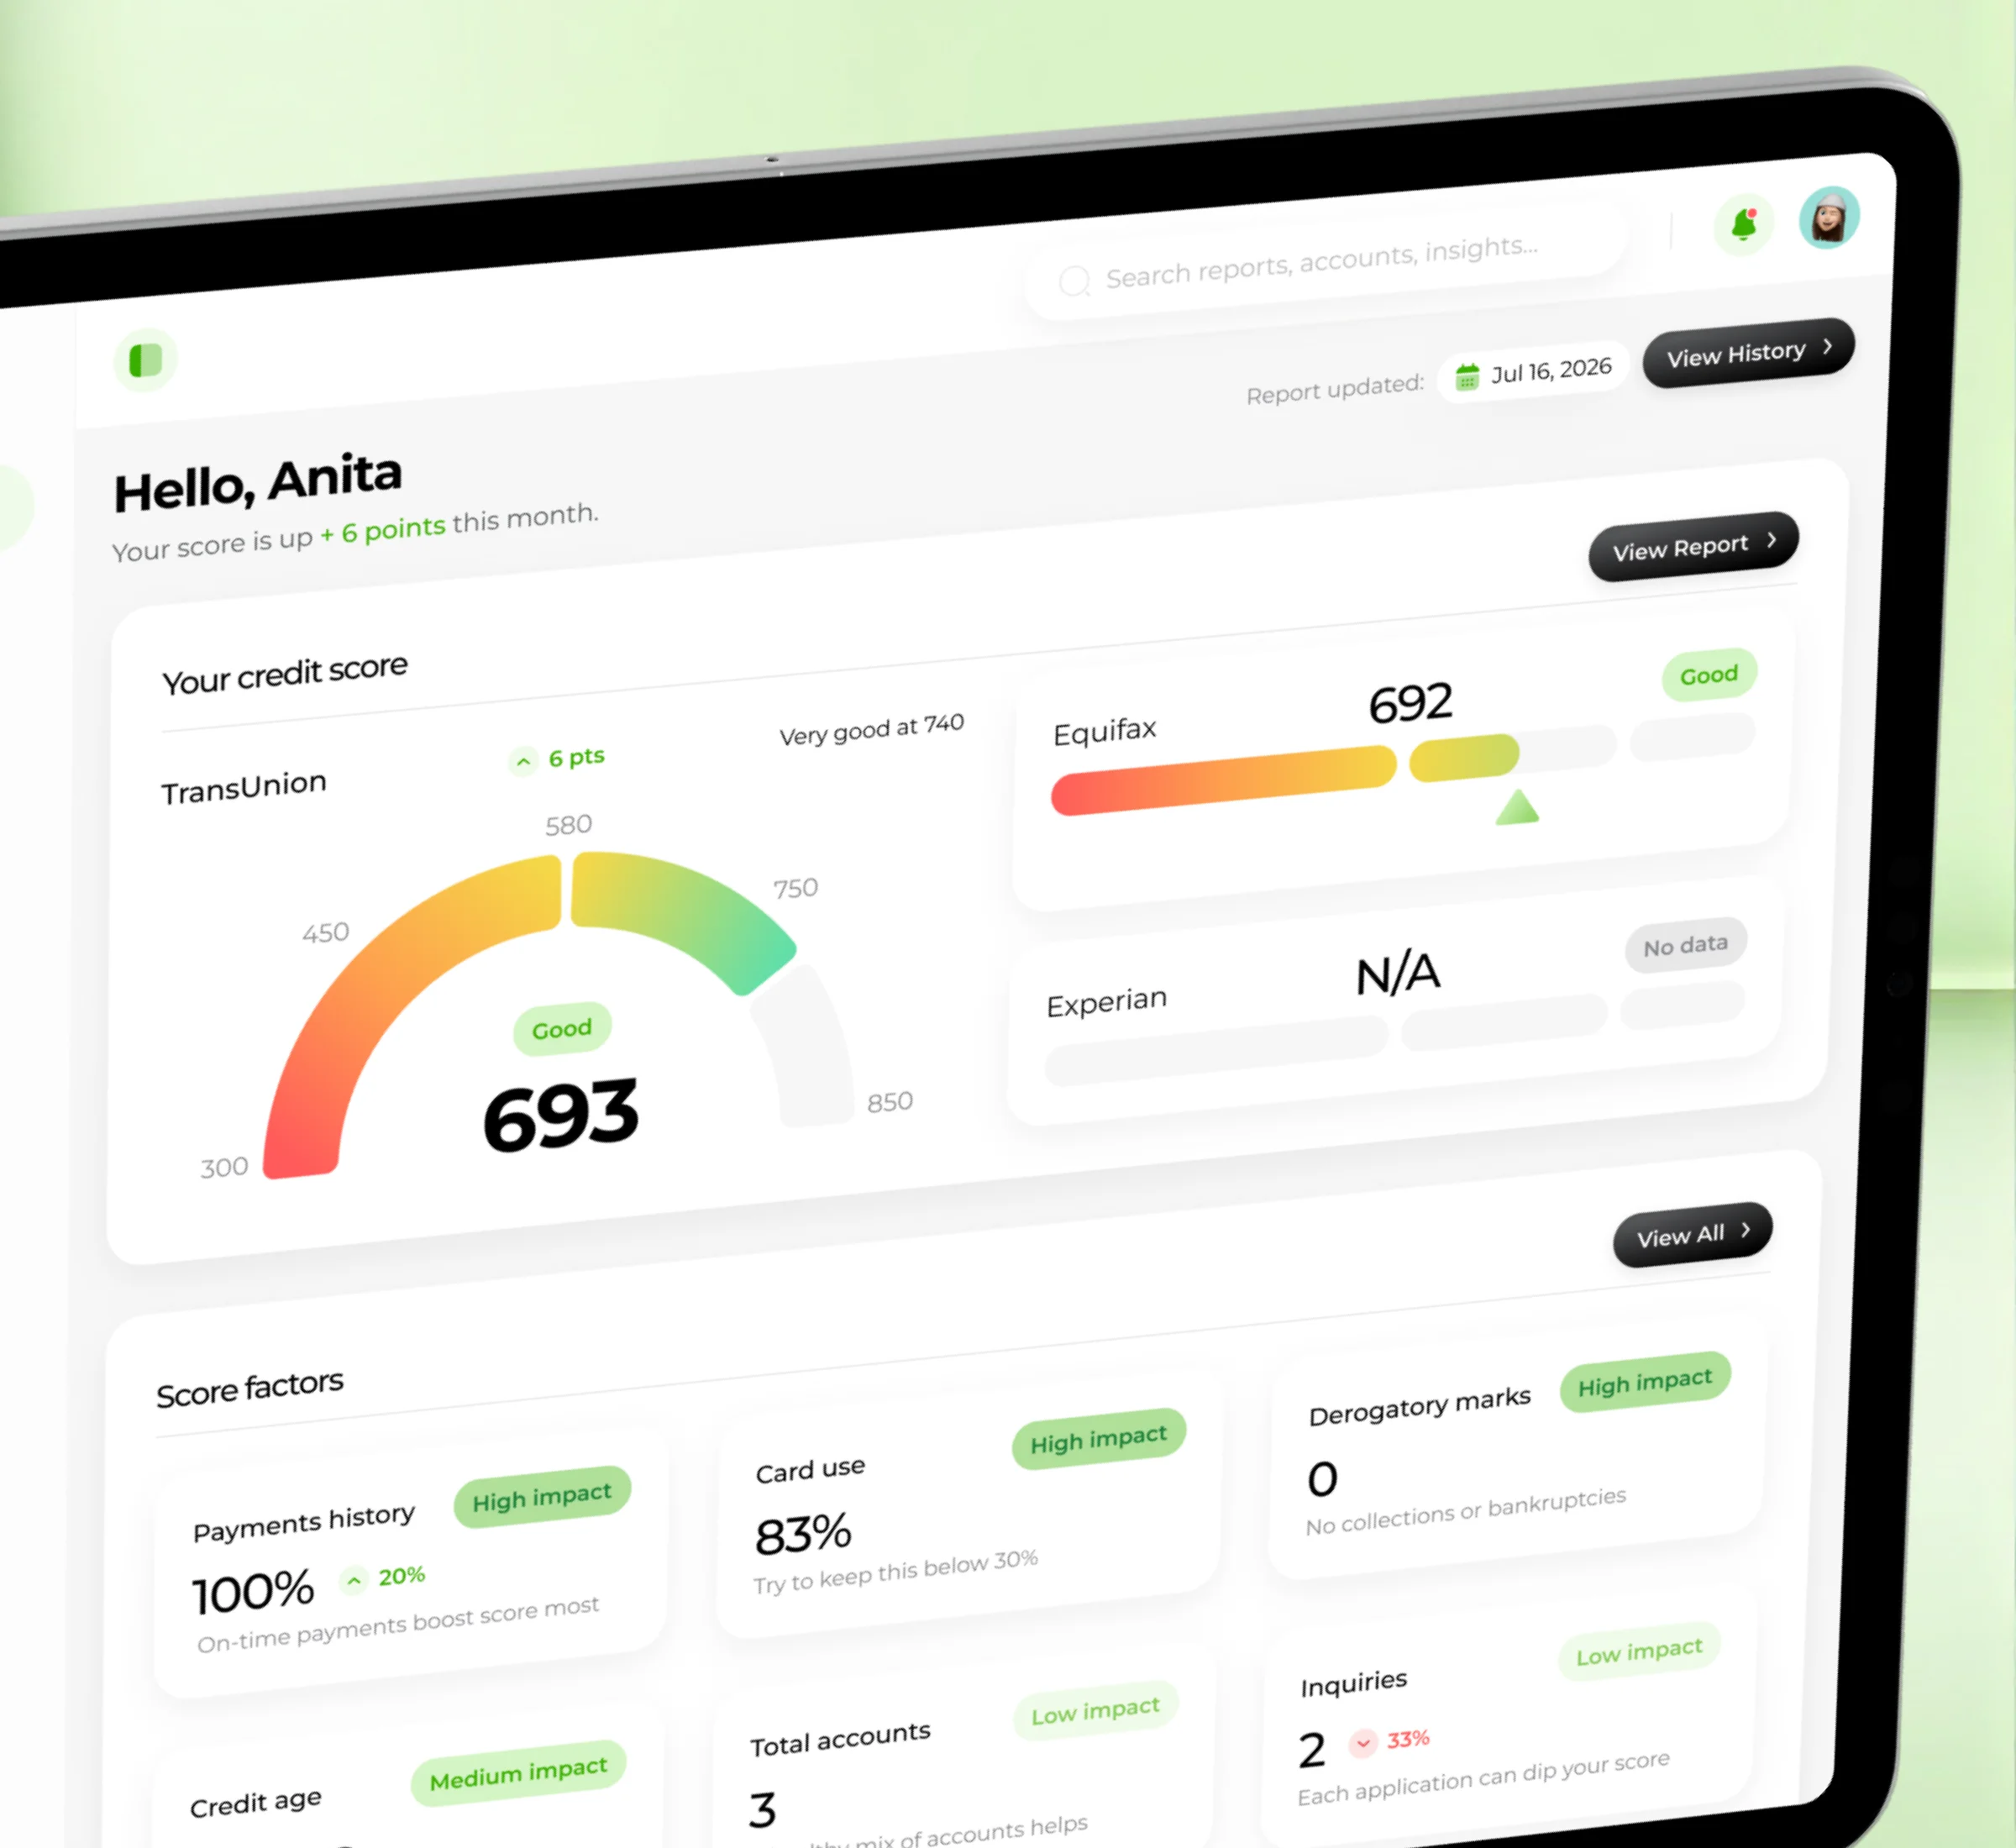
Your credit, at a glance
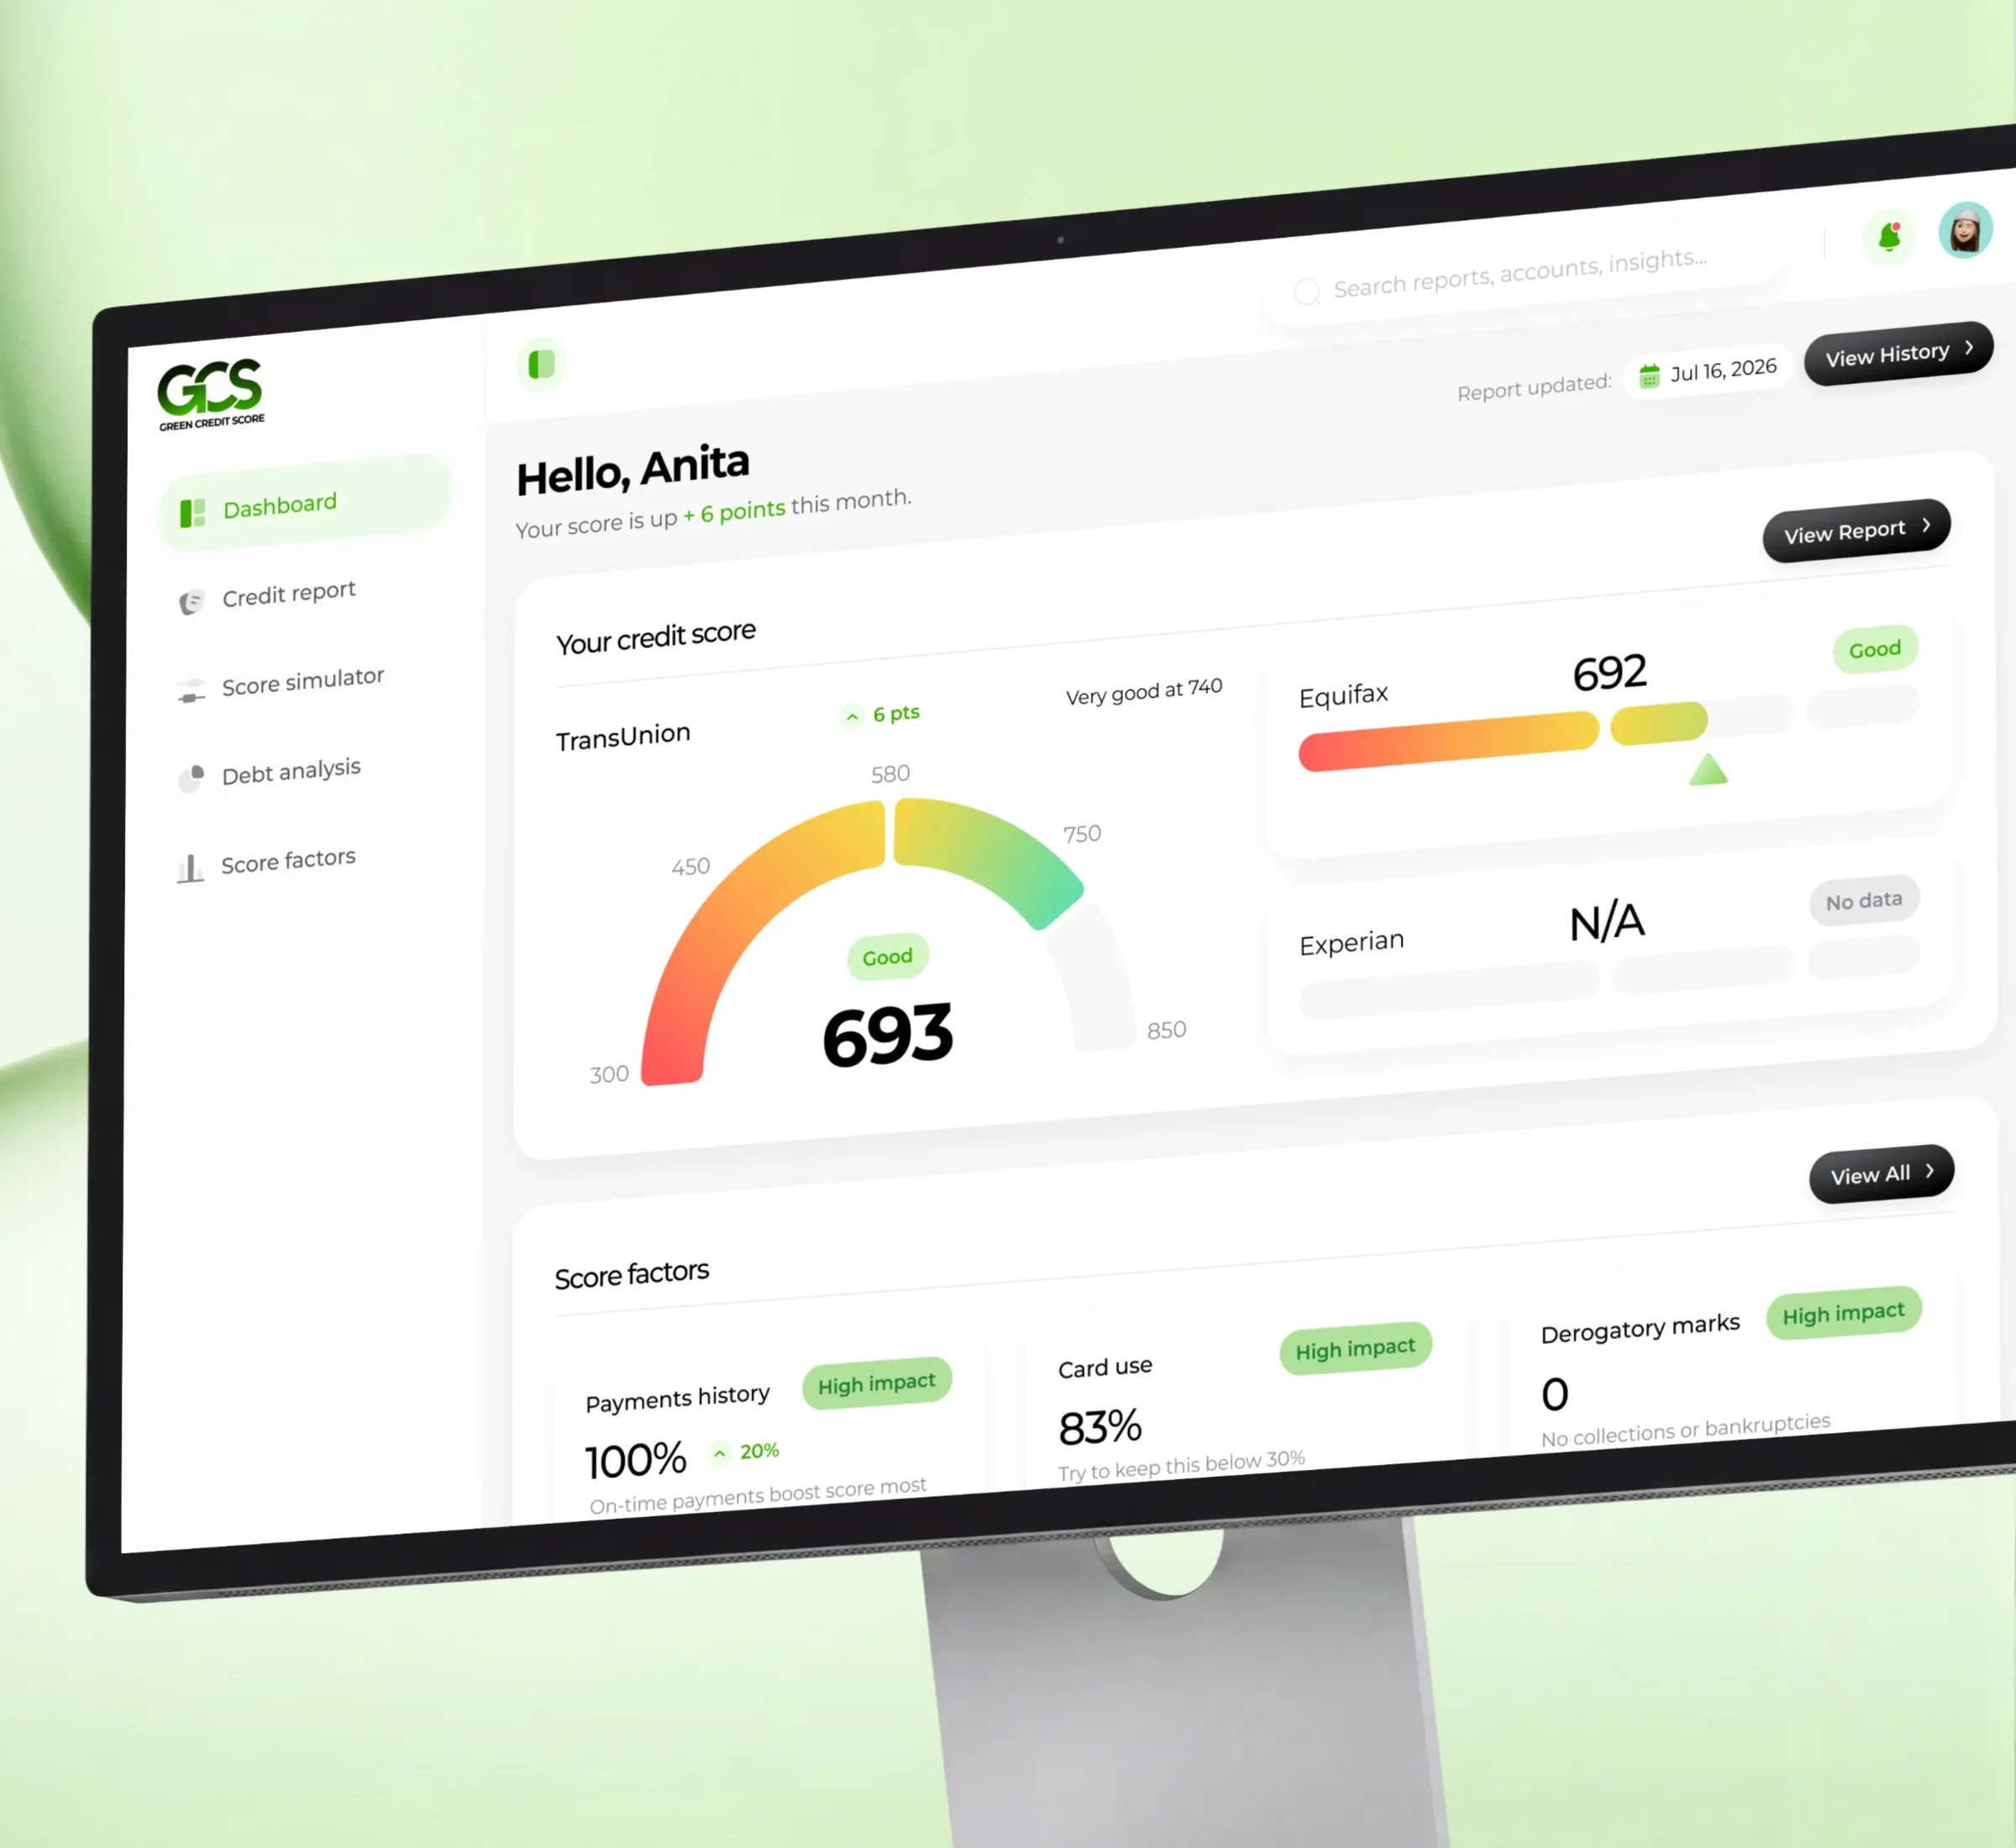
The dashboard brings scores, credit factors and debt information into one view, a clear starting point.
A clear entry point
Key information first, deeper sections one tap away.
Factors under the score
The factors behind the score sit right below it.
Details on demand
Users open individual sections to explore more.
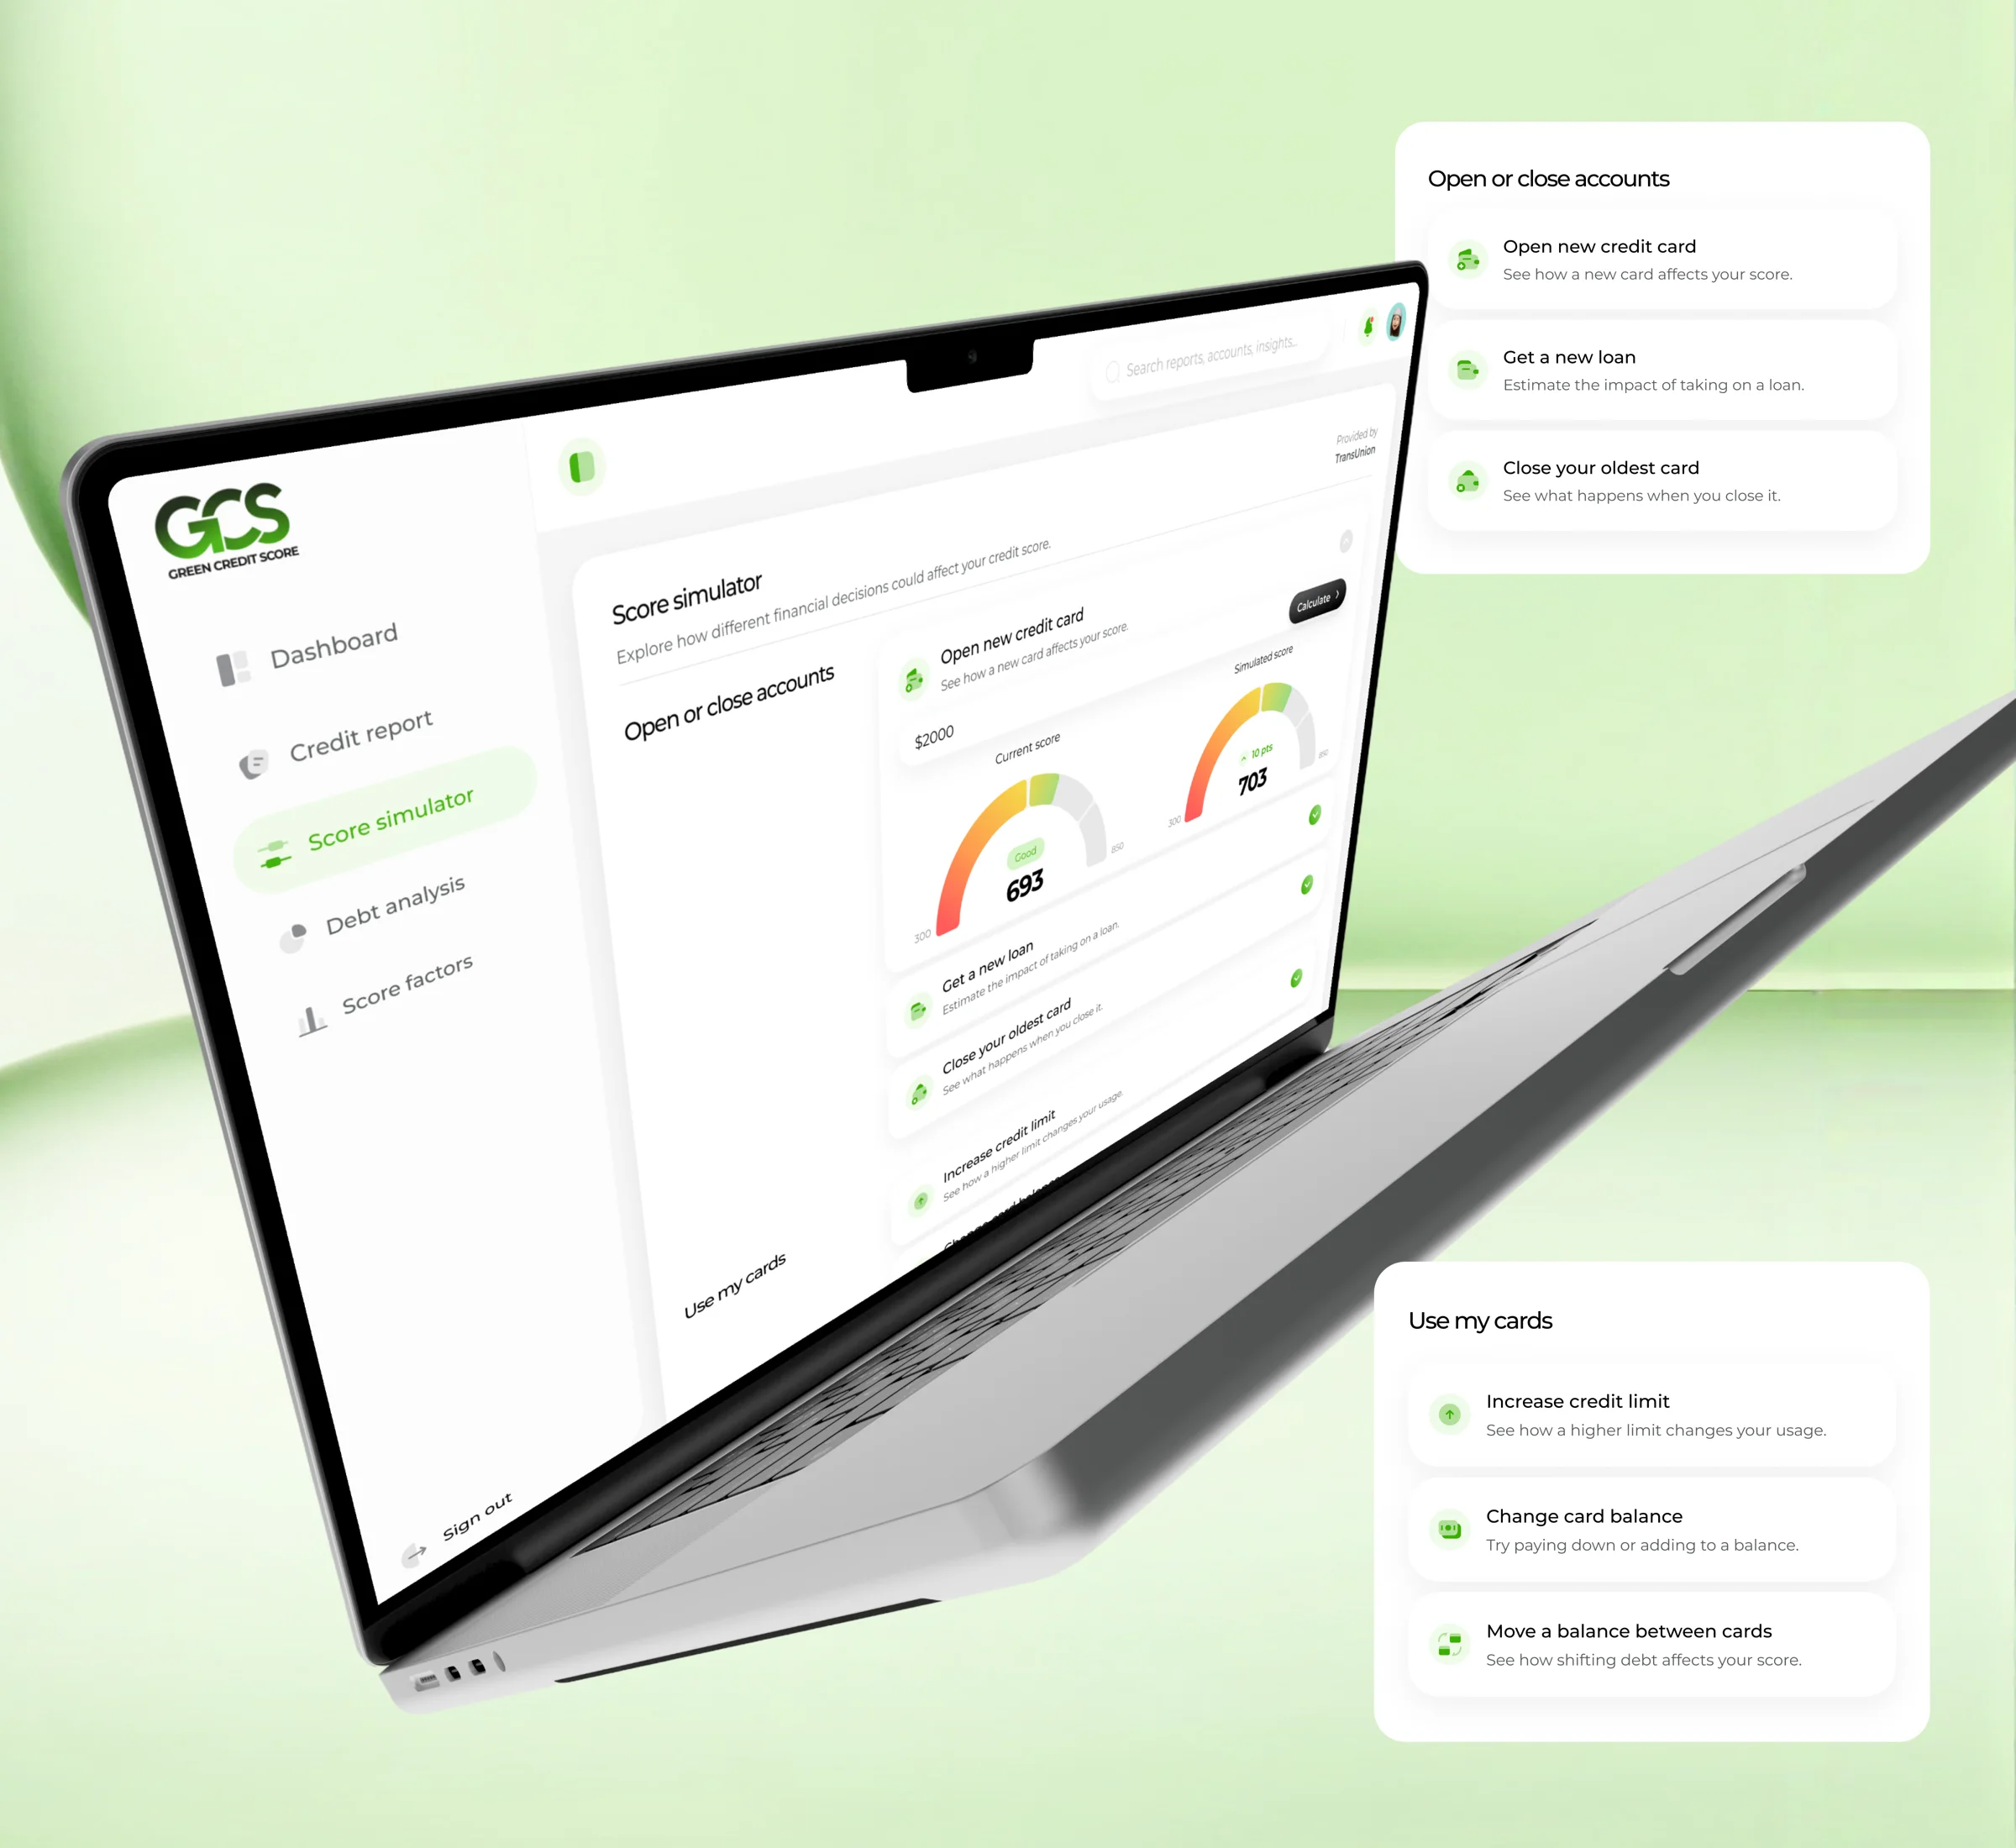
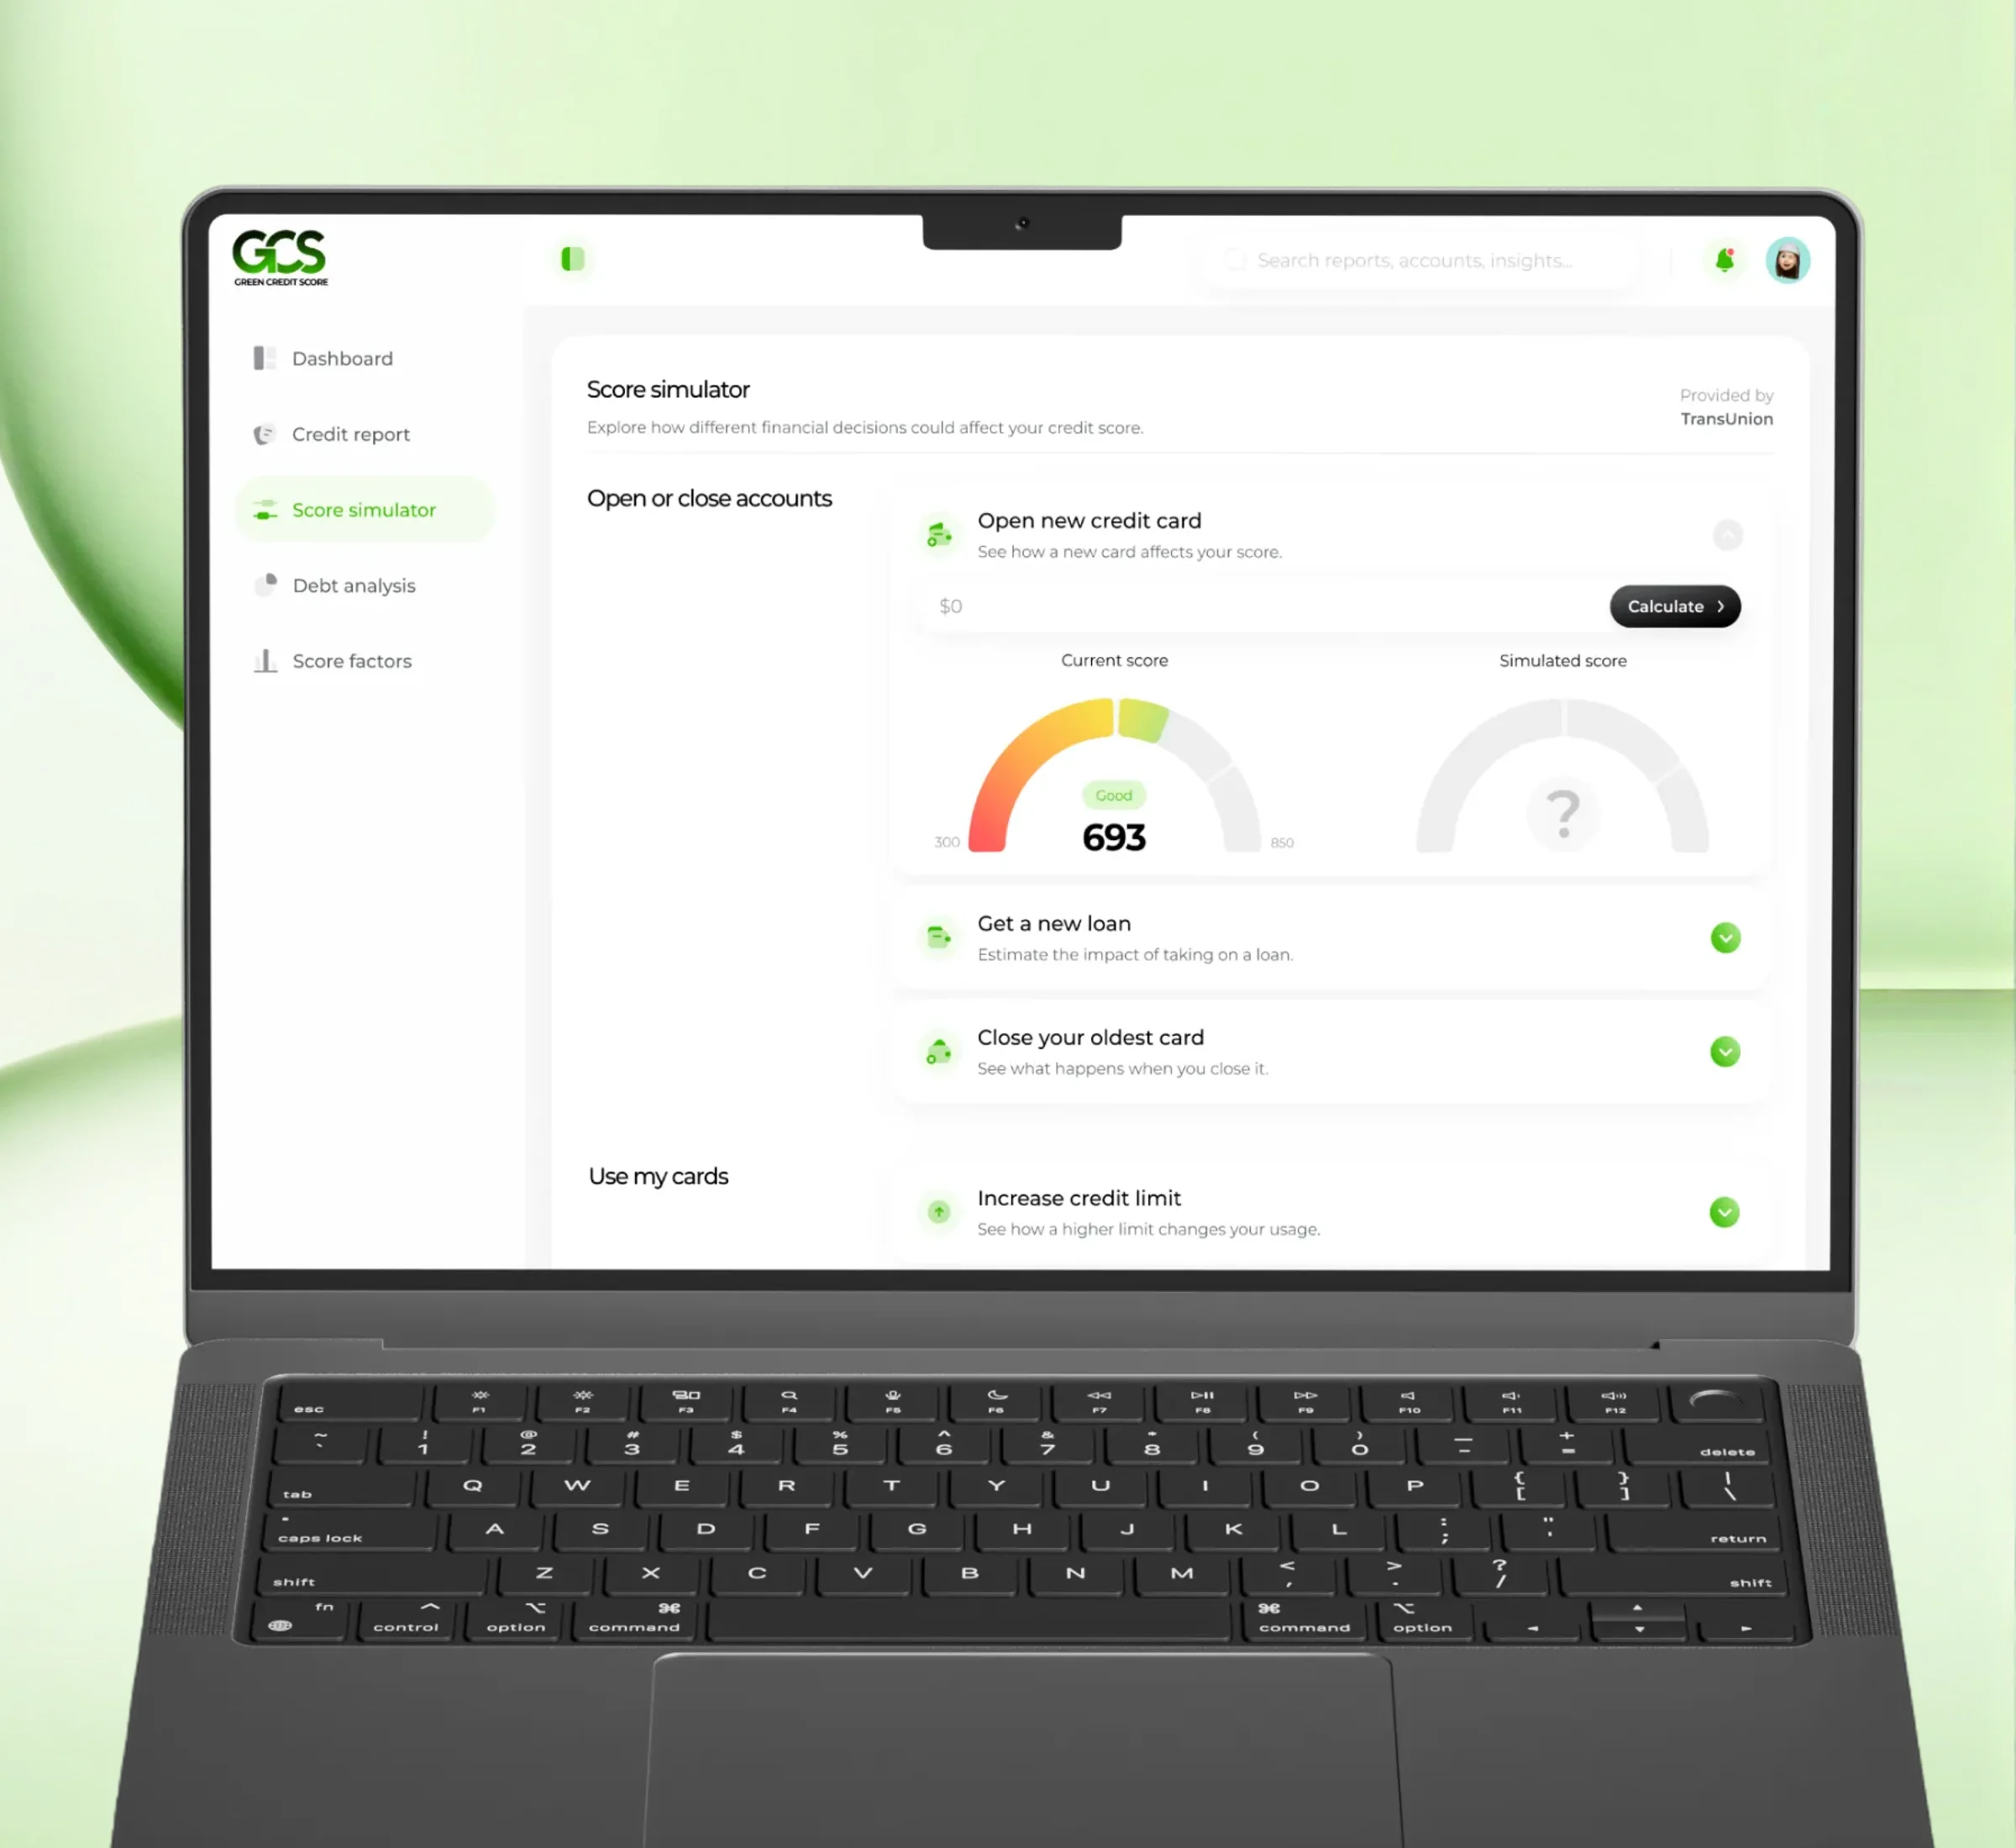
Explore possible outcomes before making a decision
Users try hypothetical scenarios and see how different choices could affect their score.
-
Open a new credit card
Explore the potential impact of a new account.
-
Get a new loan
Understand the possible effect of additional credit.
-
Increase a credit limit
Explore changes in credit utilization.
-
Close an existing card
Consider how closing an account could affect the score.
Simulated outcomes are estimates, not guarantees.
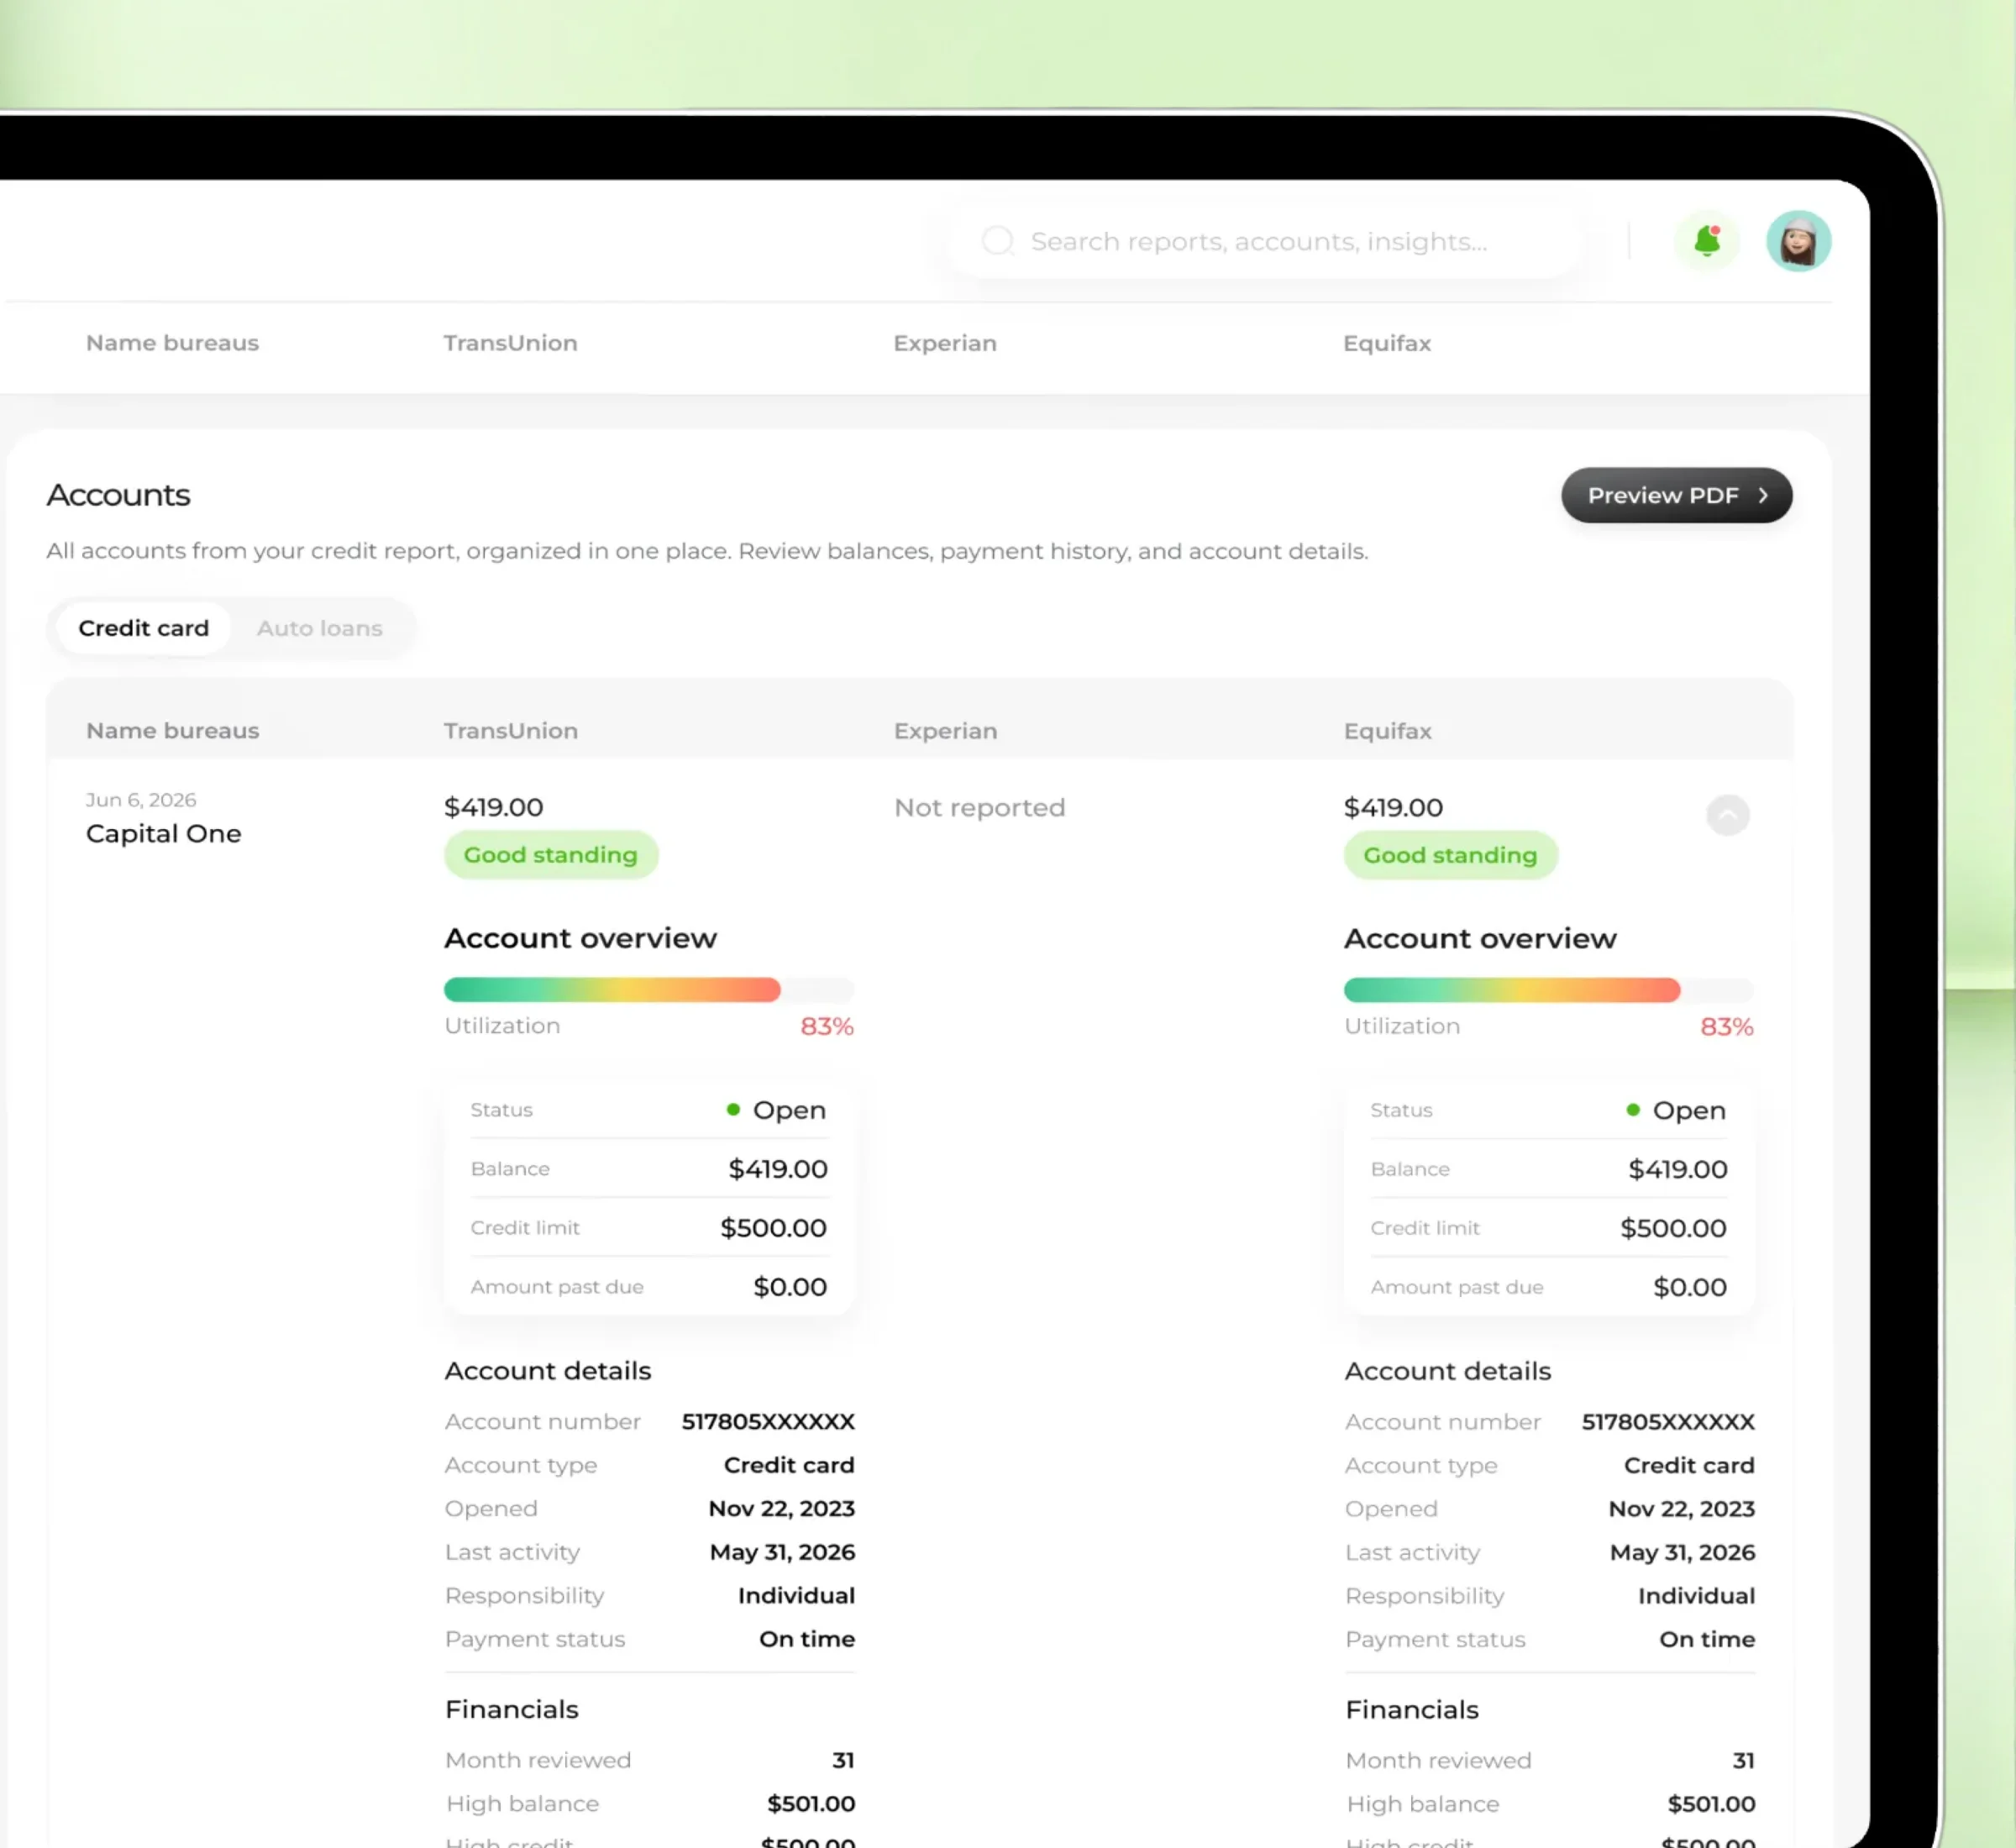
A complete report without the information overload
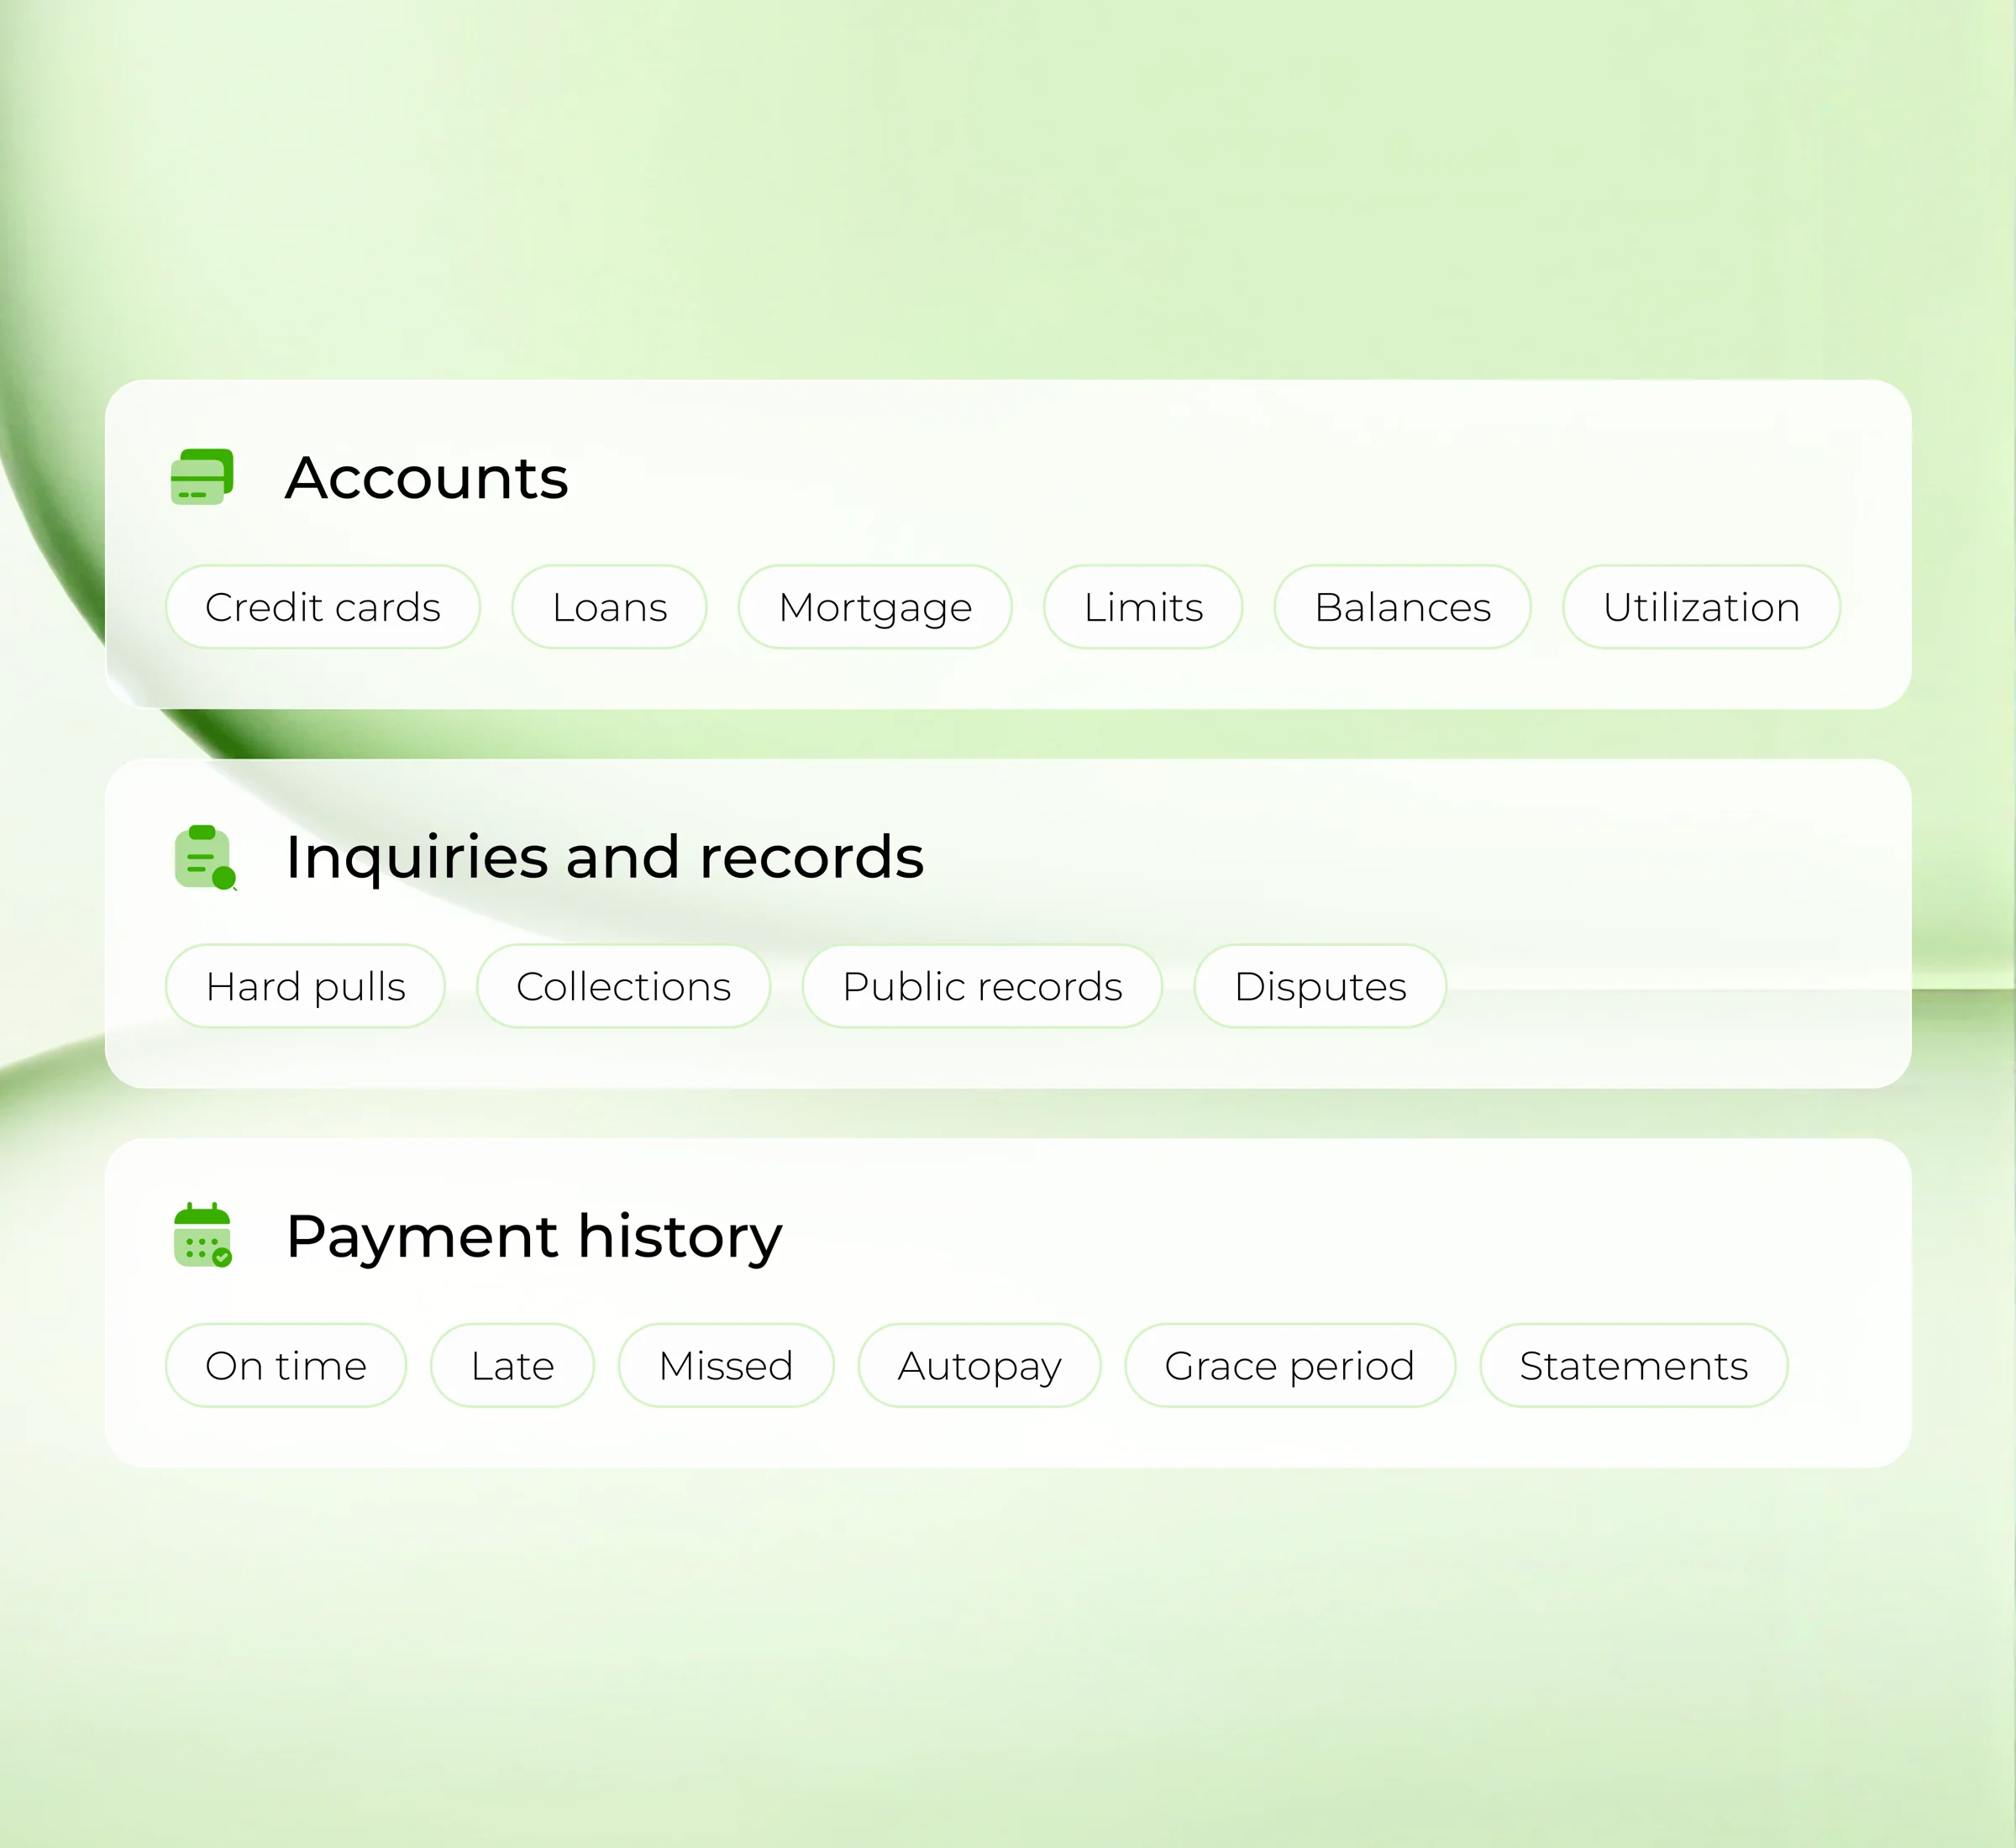
Personal information, account details, balances and payment history sit in one consistent, readable structure.
Personal information
Compare the details reported by each bureau.
Account overview
Review balances, limits, utilization and status.
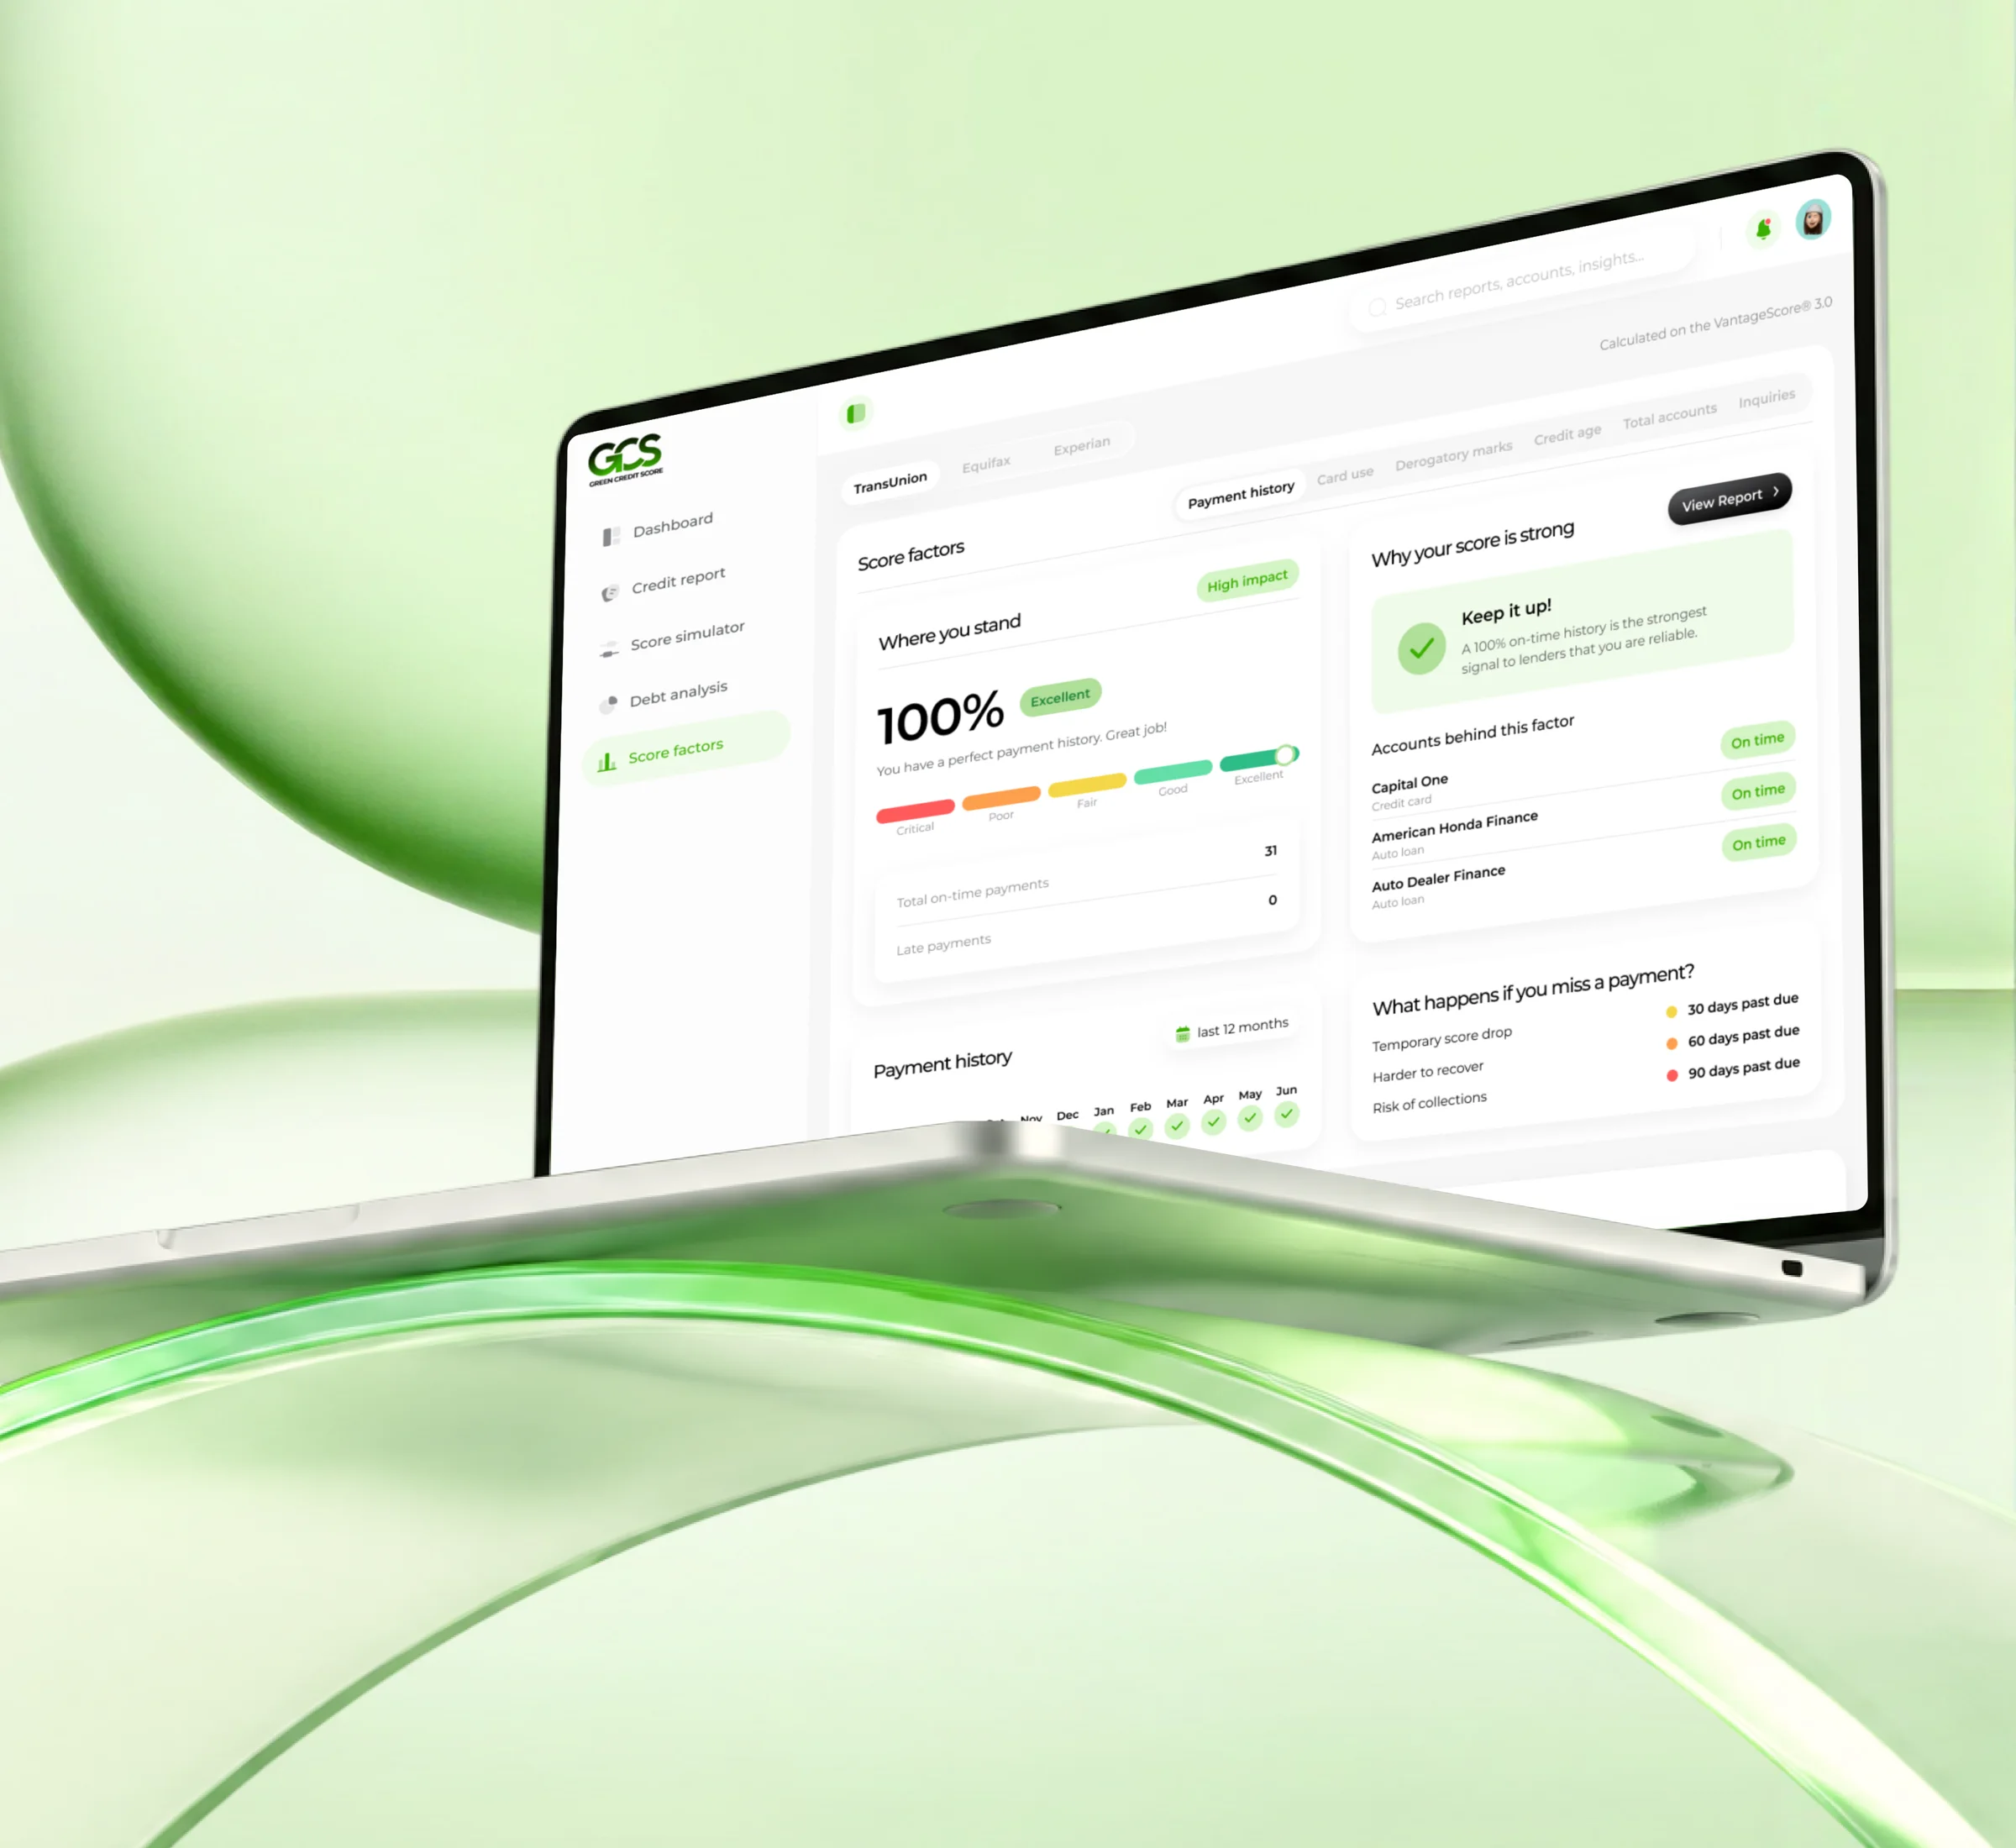
Payment history
Explore month-by-month account records.
From brief to a development-ready product
The work connected product logic, UX exploration, interface design, reusable components and responsive layouts.
- 140+
- Screens designed: dashboard, reports, account details and supporting flows
Reusable components
Shared patterns for scores, statuses, account data and comparisons.
AI-supported exploration
AI helped early exploration and design-system cleanup. Final decisions stayed with the team.
Let’s make complex products easier to understand and trust
From fintech to AI-powered experiences, I turn complex ideas into products people feel confident using.